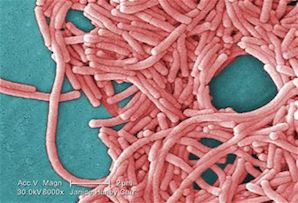
In its latest Morbidity and Mortality Weekly Report (MMWR),1 the Centers for Disease Control (CDC) has confirmed that cases of legionellosis – Legionnaires’ Disease and Pontiac Fever – have increased exponentially since 2000. The years 2000-2011 witnessed a 249% increase; in 2011, the CDC decided to initiate a large-scale Active Bacterial Core surveillance study to a) ascertain the sort of diagnostic tests being used to identify legionellosis cases, b) define the clinical course of the disease, and c) determine the differences in rate of infection between population groups.
The findings for the years 2001-2003 were sobering, indicating that the risk of infection by the potentially fatal Legionella pneumonia bacteria is significantly higher among blacks than among whites (1.5 per 100,000 vs. 1.0 per 100,000); the highest rates of infection occurred in New York while the lowest were reported in California.
These indicators, however, are old news to other epidemiologists who have long been tracking legionellosis disease rates in an attempt to prevent outbreaks. Just last year, in 2014, NYC Department of Health researchers published a study warning of the likelihood of a serious Legionnaires’ Disease outbreak occurring in New York City, emphasizing the swift increase in disease cases and targeting unmaintained cooling towers as a potential risk factor. One of the primary objectives of the researchers was to measure “the associations between acquisition of Legionella infection and socioeconomic and occupational groups.”2
Surveying 1,449 confirmed legionellosis cases in NYC from between January 2002 and December 2011, scientists ascertained that:
“… socioeconomic factors were associated with increased incidence of legionellosis. The data show a distinct gradient in incidence according to neighborhood-level poverty, ranging from 3.0 average yearly cases / 100,000 population in the highest-poverty areas to 1.2 average yearly cases / 100,000 population in the lowest-poverty areas … Legionellosis incidence also varied by racial and ethnic groups, with the highest incident among non-Hispanic blacks, a finding that was also noted in a [2011] review of nationwide legionellosis cases reported to the Centers for Disease Control and Prevention during 2000-2009.”
The epidemiologists conclude with the strong warning that “these socioeconomic disparities in disease should be of concern to public health policy makers. If environmental issues in high-poverty neighborhoods contribute to the disparity, greater effort may be warranted, for example on the upkeep of cooling towers and water systems in the buildings in these areas.”
Their warning – underscored by the earlier 2011 CDC MMWR report3 – fell on deaf ears.
Our law firm is currently providing legal representation to victims of this summer’s deadly South Bronx Legionnaires’ Disease outbreaks. These cases struck exactly where the NYC Health Department predicted they would: in the city’s highest-poverty neighborhood, attacking what has long been statistically attested as the population most vulnerable to Legionnaires’ Disease.
If you or someone you love and depend upon as been stricken by Legionnaires’ Disease, please contact attorneys Fred Pritzker and Eric Hageman at 1-888-377-8900 or use our free online consultation form.
Sources:
1. Active Bacterial Core Surveillance for Legionellosis — United States, 2011–2013. MMWR Morb Mortal Wkly Rep. 2015; 64(42);1190-3.
2.”Legionnaires’ Disease Incidence and Risk Factors, New York, New York, USA, 2002-2011,” Emerg. Infect. Dis. 2014 Nov; 20(11): 1795-1802.
3. Legionellosis—United States. 2000–2009. MMWR Morb Mortal Wkly Rep. 2011;60:1083–6 .